
End-to-End Request Profiling: Finding the Real Bottleneck
"The app feels slow" is not a diagnosis — it's a symptom with at least four possible causes: application code, a database query, a network hop, or rendering on the client. End-to-end profiling is how you turn that vague complaint into a specific, fixable answer: trace one real request all the way through the stack and measure exactly where the time goes.
Why Guessing Doesn't Work
Every layer looks like a plausible suspect from the outside. The database "feels" like it should be slow because it usually is somewhere. The network "feels" slow because it's outside your control. Without measurement, teams often optimize the layer that's easiest to blame rather than the one actually costing the most time — rewriting application code for a week when the real problem was a single missing index.
Breaking Down a Single Request
The first step is always the same: pick one slow request and account for every millisecond of it. A typical breakdown for a 220ms request looks like this:
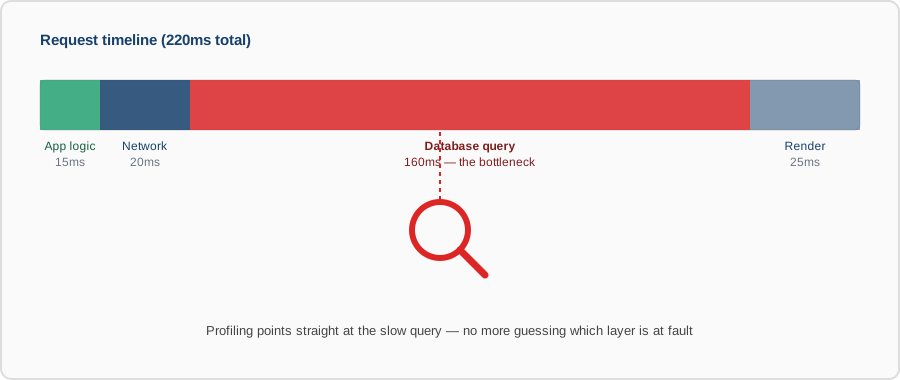
Once the request is broken into segments like this, there's no ambiguity left — 160ms out of 220ms is one database query, not "the backend in general." That's the entire point: end-to-end profiling replaces an argument about where the problem probably is with a number showing where it actually is.
The Toolbox
Distributed Tracing
For anything beyond a single process, a request typically crosses service boundaries — a web server, an API, a queue, a database. Distributed tracing (OpenTelemetry is the current standard, with backends like Jaeger, Zipkin, Tempo, or a hosted APM) assigns a single trace ID to a request and propagates it through every hop, so you get one waterfall view of the whole journey instead of five disconnected logs.
from opentelemetry import trace

tracer = trace.get_tracer("checkout-service")

with tracer.start_as_current_span("process_order"):
    with tracer.start_as_current_span("db.fetch_cart"):
        cart = fetch_cart(user_id)
    with tracer.start_as_current_span("payment.charge"):
        charge_result = payment_client.charge(cart.total)
    with tracer.start_as_current_span("db.save_order"):
        save_order(cart, charge_result)
Each nested span records its own start time and duration. The resulting trace shows exactly how much of
process_order was spent waiting on the payment provider versus the database — without adding
a single manual timestamp log.
Database-Level Profiling
When a trace points at a query, the database can usually explain itself. EXPLAIN ANALYZE in
Postgres (or its MySQL equivalent) shows the actual execution plan — sequential scans instead of index
scans, unexpectedly large row counts, missing statistics — rather than a guess about why a query is slow.
EXPLAIN ANALYZE
SELECT * FROM orders
WHERE customer_id = 48213
ORDER BY created_at DESC
LIMIT 20;
A Seq Scan on a multi-million-row table where an Index Scan was expected is
usually the whole story right there.
Application-Level Profilers
Inside a single process, sampling profilers (py-spy for Python, async-profiler
for the JVM, Go's built-in pprof) attach to a running process and produce a flame graph — a
visual breakdown of which functions consumed the CPU, without needing to instrument the code by hand.
Client-Side Timing
If the complaint is "the page feels slow" rather than "the API is slow," the trace needs to extend into the browser. The Navigation Timing and Resource Timing APIs (surfaced directly in browser DevTools) show DNS lookup, TLS handshake, time-to-first-byte, and render time separately — often revealing that the backend was fine and a render-blocking script was the actual cause.
Reading the Result
- Look for the largest single segment first. A 160ms segment in a 220ms request matters more than three 5ms segments combined.
- Compare against a baseline. "160ms" only means something next to "this query normally takes 12ms."
- Watch for N+1 patterns. A trace showing the same query repeated 40 times back-to-back is a different fix (batching) than one slow query.
- Don't stop at the first bottleneck. Fixing the biggest segment often just promotes the second-biggest one — profile again after the fix.
Common Pitfalls
- Profiling in staging only. Data volume and concurrency in staging rarely match production closely enough for the numbers to transfer directly.
- 100% sampling in production. Full tracing has real overhead at scale — most teams sample a percentage of requests rather than tracing everything, everywhere, always.
- Clock skew across hosts. Distributed traces spanning multiple machines need synchronized clocks (NTP), or span ordering and durations can look wrong.
- Treating one slow request as representative. A single trace tells you what happened once — look at percentiles (p95, p99) before deciding it's a systemic issue.