
Monitoring and Logging Solutions
You can't fix what you can't see, and you can't see what was never instrumented. We build the observability stack — metrics, logs, alerts, and traces — that turns "something feels off" into a specific answer.
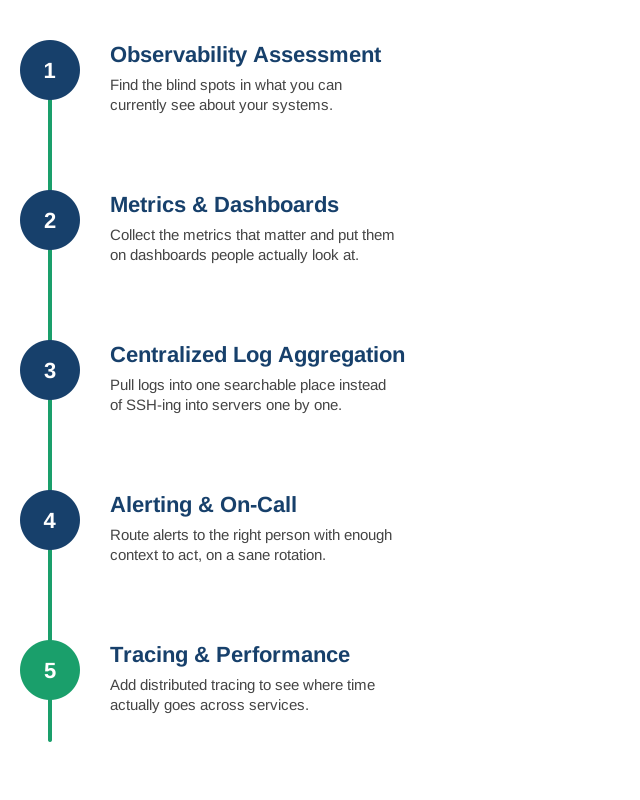
1. Observability Assessment
We identify the actual blind spots — the services with no metrics, the errors that only show up when a customer complains — before choosing any tooling.
- Coverage audit: which services have metrics, logs, and alerts today, and which are running essentially invisible.
- Detection gap analysis: past incidents reviewed for how they were actually noticed — a customer complaint is a signal that monitoring failed.
- Tool sprawl review: how many overlapping monitoring tools are already in use, and whether consolidation would help more than adding another one.
- Signal-to-noise baseline: current alert volume and how much of it people have already learned to ignore.
2. Metrics Collection and Dashboards
Metrics that reflect real system and business health, on dashboards people actually check, not a wall of graphs nobody looks at after week one.
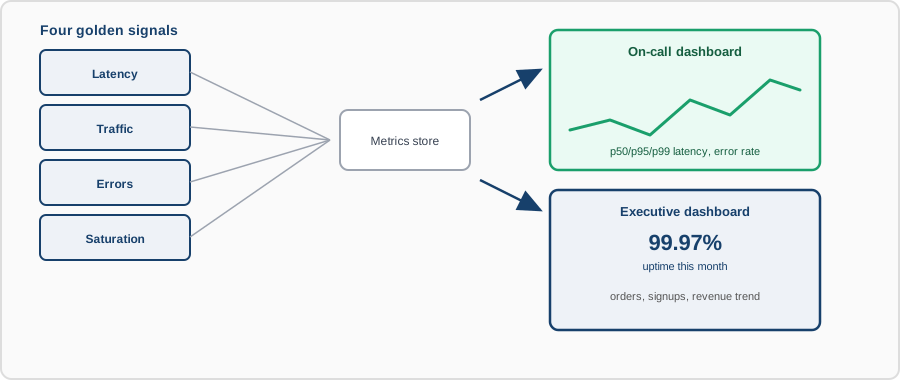
- The right metrics: the four golden signals — latency, traffic, errors, saturation — covered for every critical service, not just whatever's easy to expose.
- Business metrics alongside system metrics: signups, orders, or revenue tracked next to CPU and memory, since a healthy server serving a broken checkout flow is still an incident.
- Purposeful dashboards: one dashboard per audience — an on-call engineer and an executive need different views of the same system.
- Retention tuned to use: high-resolution data kept short-term, downsampled data kept longer, instead of paying to store everything at full resolution forever.
3. Centralized Log Aggregation
Logs from every service pulled into one searchable place, so debugging an incident doesn't mean SSH-ing into five different machines.
- Structured logging: logs emitted as structured data (JSON, key-value) instead of free-text lines that are hard to query at scale.
- Centralized collection: every service ships logs to one platform, searchable across the whole system in one place.
- Correlation IDs: a request ID threaded through every log line it touches, so a single user's request can be followed end to end.
- Retention and cost control: log volume and retention tuned deliberately, since unbounded logging is one of the fastest ways to an unexpectedly large bill.
4. Alerting and On-Call Setup
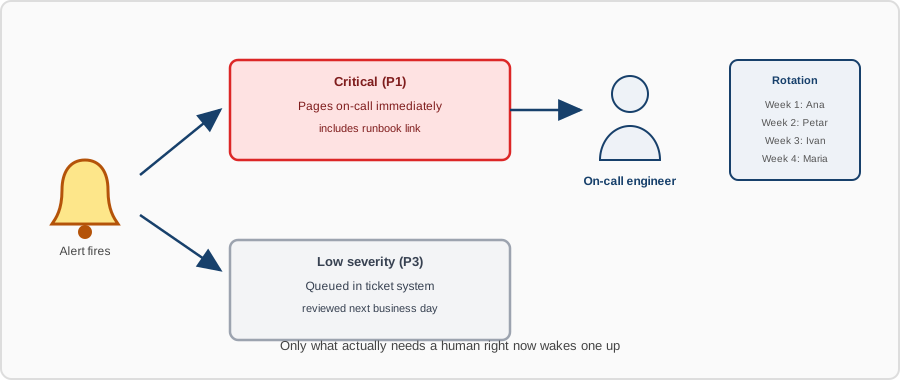
Alerts routed to the right person with enough context to act, on an on-call rotation that's sustainable rather than one person permanently on the hook.
- Actionable alerts only: every alert tied to something a human can actually do about it — anything else is a dashboard metric, not a page.
- Severity-based routing: critical issues page immediately; lower-severity ones queue for business hours instead of waking someone up.
- Fair rotation: on-call spread across the team on a sustainable schedule, not resting permanently on whoever set the system up.
- Runbook links in alerts: the alert itself links to the relevant runbook, so response doesn't start with "what does this even mean."
5. Tracing and Performance Insight
Distributed tracing added where it matters, so a slow request can be followed across services instead of guessed at — see our end-to-end request profiling article for how that works in practice.
- Instrumentation strategy: tracing added at service boundaries first, where most cross-service latency actually hides.
- Sampling approach: a sampling rate that keeps overhead reasonable at scale while still catching the slow outliers.
- Trace-log-metric correlation: the three signal types linked together, so a trace can jump straight to the relevant logs.
- Performance baselines: normal latency established per endpoint, so "slow" means something measurable, not a feeling.
Contact us to build out observability from scratch, or to make sense of monitoring tools you already have but don't fully trust.