
Workload Requirements
Back to Server Setup · Capacity Planning · Service Offerings
Defining workload requirements means establishing what applications and services need to run, the expected traffic and usage patterns, and the peak-load scenarios — before anyone chooses hardware. It is the first stage of a server setup, and skipping it is why so many servers are simultaneously oversized and too slow: too much of the resource that was never the constraint, too little of the one that was.
The useful question is never “how big a server do we need?”. It is four questions: what work, how much of it, how unevenly it arrives, and how fast it has to be answered. Get those, and the hardware follows almost mechanically. Skip them, and you are buying by intuition.
1. What the Workload Actually Needs
Every workload is constrained by one resource at a time, and adding more of any other changes nothing. The first job is to identify which.
- CPU-bound — compression, encoding, rendering, cryptography, heavy application logic. Cares about clock speed and core count, and about which of the two: single threads want fast cores, parallel batches want many. These are different processors.
- Memory-bound — databases, caches, in-memory analytics, JVM applications. The critical question is whether the working set fits in RAM, because a workload that fits runs at memory speed and one that spills runs at disk speed. That boundary is a cliff, not a slope.
- I/O-bound — and here the distinction that gets missed: IOPS and throughput are not the same requirement. Many small random reads (a transactional database) need IOPS and low latency. Few large sequential reads (backups, video, analytics scans) need megabytes per second. A disk excellent at one can be poor at the other.
- Network-bound — file serving, media, replication, chatty microservices. Bandwidth, but also packets per second and latency, which are separate limits and fail differently.
Most real systems are one of these with a secondary constraint waiting behind it. Identifying the order matters, because relieving the first one promotes the second — which is why an upgrade sometimes produces less improvement than expected. Where a system already exists, this is measurement, not estimation: see request profiling.
Beyond the four, we record what the software itself demands: supported operating systems and versions, minimum specifications the vendor will actually support, GPU requirements, architecture (x86-64 or ARM) and whether every dependency has builds for it, and licence constraints — which can make the core count a commercial decision rather than a technical one.
2. The Shape of the Traffic
Averages hide everything that matters. A server sized for mean load will be underwater during every peak that mean was averaged from.
- The daily and weekly shape. Business applications concentrate most of the day's work into a few hours. Consumer traffic has evening peaks. Batch systems are idle then saturated. The peak-to-average ratio is the number worth writing down — 3:1 and 20:1 are very different machines.
- The annual shape. Retail at Christmas, accounting at year end, education at enrolment, payroll on the same date every month. These are predictable and therefore no excuse.
- Concurrency versus throughput. Distinct requirements. A hundred requests a second each taking a second means about a hundred in flight at once; a hundred a second each taking ten milliseconds means about one. Little's Law — concurrency = arrival rate × time in system — is a one-line calculation and it sizes connection pools, worker counts and thread limits more reliably than any rule of thumb.
- The read-to-write ratio, which decides whether caching and read replicas help at all, and the request size distribution, because a handful of very large requests can consume more than all the small ones together.
- Growth. Today's traffic and the expected rate of change, so the sizing has a stated lifetime rather than an implied one.
3. Peak-Load Scenarios
The peak that breaks a system is usually not the busy hour. It is a specific, nameable event, and the exercise is to list them explicitly rather than to add a safety margin and hope.
- The predictable commercial peak — a sale, a campaign email, a deadline. Known in advance, and the easiest to plan for.
- The cold start. After a restart or deployment, caches are empty and every request goes to the origin. A system comfortable at steady state can be unable to start under load at all — and this peak arrives exactly when you are already recovering from something.
- The retry storm. A brief slowdown causes clients to retry, which multiplies load, which worsens the slowdown. Self-amplifying, and the reason a small incident becomes an outage.
- The cron stampede. Everything scheduled on the hour runs on the hour. The fix is usually free — stagger them — but only if someone noticed.
- Degraded-mode peak. If the design survives one node failing, the survivors carry its share. Peak load on a two-node pair is not half the traffic; it is all of it. Sizing for the healthy case guarantees the failure cascades — which is where this connects to high availability.
- The recovery peak. Coming back from an outage means a backlog, a queue to drain and every client reconnecting at once. Relevant to disaster recovery planning, and routinely larger than normal peak.
4. Why Headroom Is Arithmetic, Not Caution
“We're only at 85% CPU” sounds like efficient use of a purchase. It is not, and the reason is queueing rather than opinion. As utilisation rises, requests increasingly wait behind other requests, and that wait grows without limit as utilisation approaches 100%.
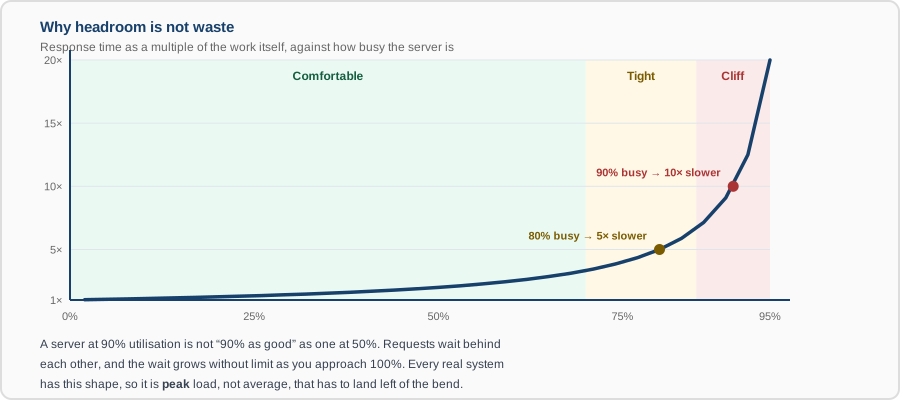
In the idealised single-queue model, response time is service time divided by (1 − utilisation). At 50% busy, work takes twice as long as the work itself. At 80%, five times. At 90%, ten times. At 95%, twenty. Real systems deviate in the details — multiple cores, uneven arrivals and variable service times all shift the curve — but none of them removes the bend, and bursty traffic makes it worse rather than better.
The practical consequence: it is peak utilisation that has to sit left of the bend, not average. A server averaging 30% but hitting 92% for twenty minutes every afternoon is a server that is slow every afternoon, and the daily average will never show it.
5. The Requirements That Are Not About Load
- Latency targets as percentiles. An average response time is close to meaningless — it is dominated by the fast majority. State p95 and p99. The p99 is what your busiest users experience on almost every page they load, because a session of many requests will reliably contain a slow one.
- Availability, stated as a number with a measurement window, and what downtime actually costs — which is what decides whether redundancy is worth its price.
- RTO and RPO, since they determine the backup and replication design and therefore part of the hardware.
- Data volume and retention — both current size and growth rate, plus how long records must be kept, which is frequently a legal answer rather than a technical one.
- Maintenance windows. A system that can never be taken down needs a different topology from one that can pause at 03:00 on a Sunday, and that is a sizing input, not an operational detail.
6. When There Is Nothing to Measure Yet
For a system that does not exist, honest estimation beats confident guessing:
- Derive load from the business numbers — users, transactions per user, hours in which they happen. An order of magnitude, stated as such, is worth more than a precise invention.
- Measure a comparable system, yours or a similar deployment of the same software.
- Load-test a prototype against the traffic shape you expect, not against a flat line.
- Prefer platforms that can be resized. Where the requirement is genuinely unknown, the right answer is often to buy less and keep the option to grow — provided someone is watching the meters to know when.
What You Get
- A per-application profile: the constraining resource, the secondary one, and the platform and licensing constraints attached to it.
- The traffic shape in numbers — average, peak, peak-to-average ratio, concurrency, and growth rate with a stated horizon.
- A named list of peak scenarios including the degraded-mode and recovery cases, each with a load figure rather than an adjective.
- Latency, availability and retention targets written as measurable numbers.
- A sizing recommendation that states the assumptions it rests on, so it can be re-checked when the traffic changes instead of quietly going stale.
This feeds straight into server selection and, once the system is live, into capacity planning — where the same numbers get compared against reality.