
Performance Tuning and Capacity Planning
Systems that ran fine at launch don't always stay that way as usage grows. We find where performance is actually being lost, and plan capacity ahead of when you'd otherwise find out the hard way.
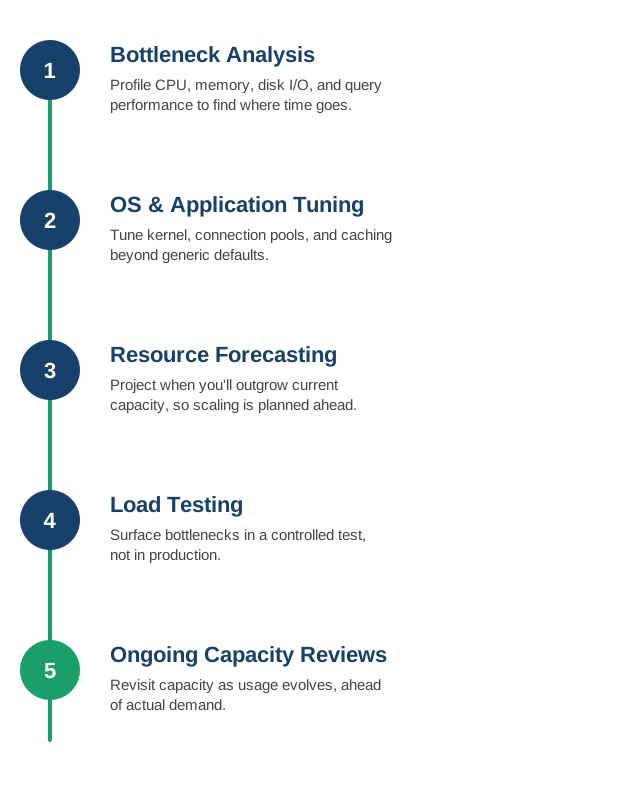
1. Bottleneck Analysis
We profile CPU, memory, disk I/O, and database query performance to find where time is actually being spent, instead of guessing at what to optimize.
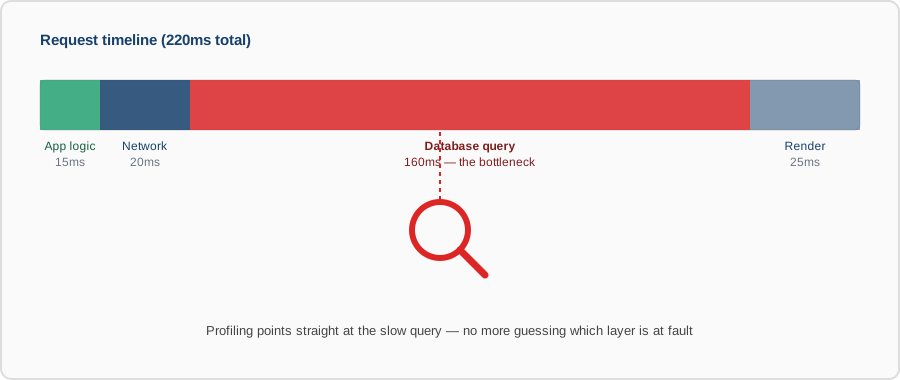
- End-to-end profiling: tracing a slow request through the full stack — app code, database queries, network hops — instead of guessing which layer is at fault.
- Resource utilization breakdown: CPU, memory, disk I/O, and network measured separately, since "the server feels slow" usually means one specific resource is maxed out.
- Slow query identification: pulling the actual worst-performing database queries, often the single biggest win available.
- Evidence before action: optimizing what profiling actually shows is slow, not whatever seems like the obvious suspect.
2. OS and Application Tuning
From kernel and filesystem parameters to application-level connection pools and caching, we tune the settings that most default installs leave at generic values.
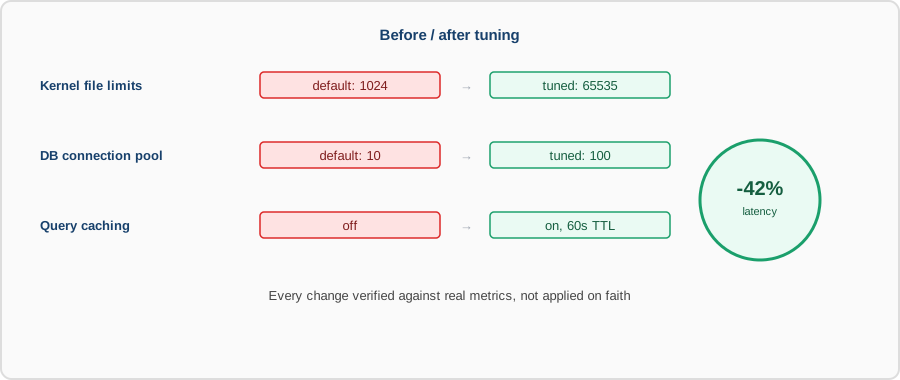
- Kernel and filesystem parameters: file descriptor limits, TCP settings, and I/O schedulers adjusted for actual workload instead of distro defaults sized for a generic server.
- Connection pool sizing: database and HTTP connection pools sized to match real concurrency, avoiding both starvation and wasted overhead.
- Caching strategy: application, query, and CDN caching applied where it actually reduces load, not layered on everywhere by default.
- Before-and-after measurement: every tuning change verified against real metrics, so you know what actually helped versus what just felt like it should.
3. Resource Forecasting
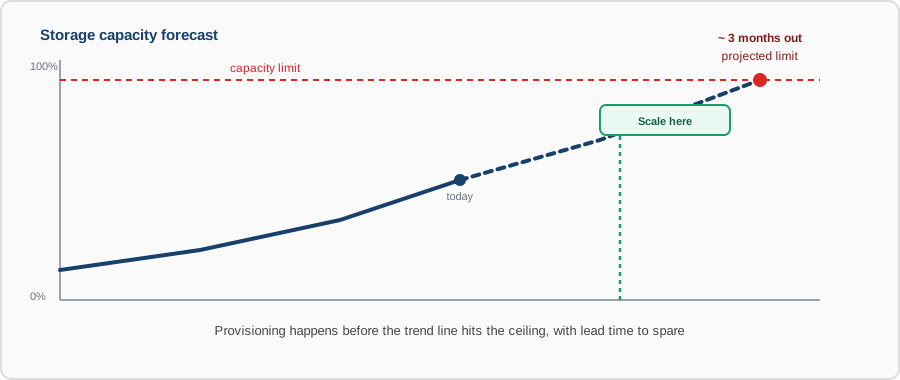
Using current growth and usage trends, we project when you'll outgrow current CPU, memory, storage, or database capacity — so scaling is planned, not reactive.
- Trend-based projections: extrapolating from actual usage growth, not a generic percentage guess.
- Per-resource runway: separate forecasts for CPU, memory, storage, and database capacity, since they rarely run out at the same time.
- Lead-time awareness: factoring in how long it actually takes to provision more of each resource, so the warning arrives with enough runway to act.
- Scenario modeling: forecasts adjusted for known upcoming events — a marketing push, a new client, a seasonal spike — not just steady-state growth.
4. Load Testing
We load-test systems against realistic traffic patterns before a big launch or seasonal spike, surfacing bottlenecks in a controlled test instead of in production.
- Realistic traffic modeling: load patterns based on actual usage shapes — bursty, sustained, or spiky — not just a flat ramp-up that misses how real traffic behaves.
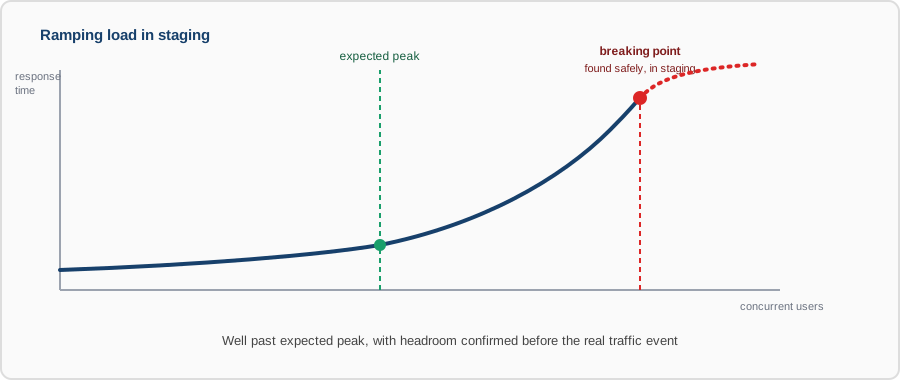
- Breaking point identification: pushing past expected load deliberately, so you know the actual ceiling instead of an assumed one.
- Controlled environment: tests run against staging or an isolated environment, so finding the breaking point doesn't create an outage of its own.
- Pre-launch validation: a scheduled load test ahead of any known traffic event, not a hope that current capacity will happen to be enough.
5. Ongoing Capacity Reviews
We revisit capacity and performance periodically as usage evolves, so scaling decisions stay ahead of actual demand rather than catching up to it.
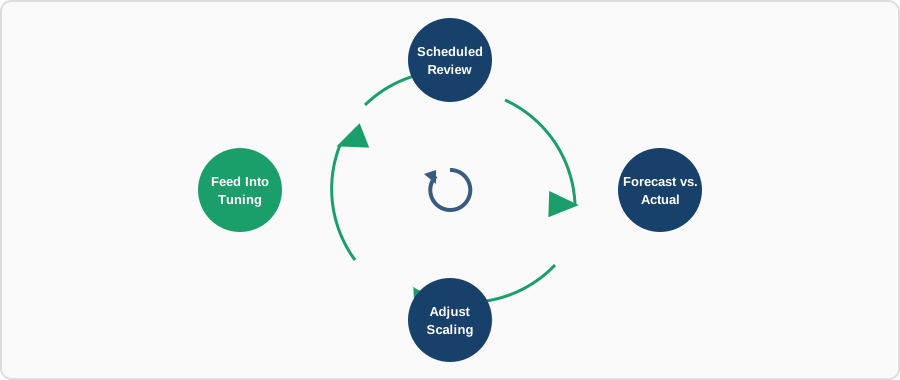
- Scheduled cadence: capacity reviewed on a set interval, not only after something already started running hot.
- Forecast vs. actual: comparing prior projections against what really happened, so future forecasts keep getting more accurate.
- Cost-aware scaling: balancing headroom against spend, since "just over-provision everything" isn't a real capacity strategy.
- Feeds back into tuning: review findings loop back into bottleneck analysis and tuning, keeping the whole cycle current as the system evolves.
Contact us for a performance review, or to plan capacity ahead of your next growth phase.